The Clean Hierarchy of “Cheapness”
A practical guide to understanding where real asymmetric opportunities hide
Investors often talk about “cheap stocks,” but cheapness is not a single category — it’s a spectrum. Some forms of cheapness signal opportunity; others signal danger. The key is distinguishing between quality mispricing and distress mispricing, because they lead to very different outcomes.
This hierarchy shows where the market is mispricing reality — and where asymmetric upside actually lives.
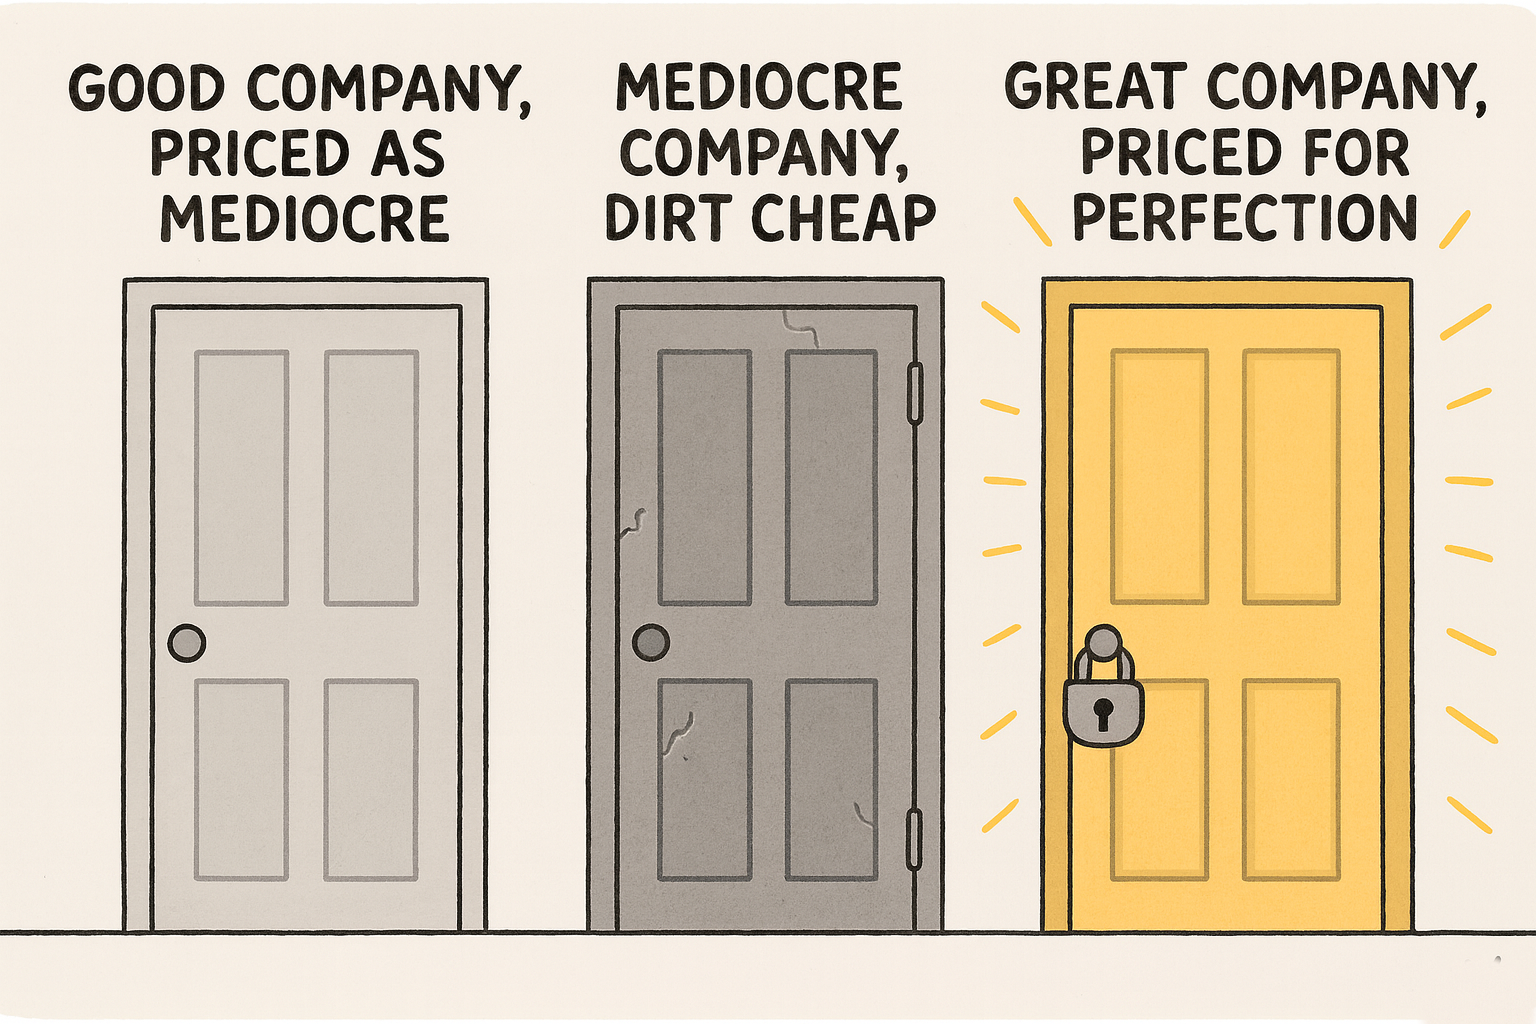
1. Good Companies Priced as Mediocre
The most attractive form of cheapness.
A fundamentally strong company — durable business model, healthy balance sheet, competitive advantages — can temporarily fall out of favor. The business remains solid, but the market prices it as if it’s merely average.
Characteristics
Quality: high
Price: discounted, but not “dirt cheap”
Expectations: low
Risk: moderate
Upside: strong if sentiment normalizes
This is the classic setup for asymmetric upside: the downside is cushioned by real fundamentals, while the upside comes from the market correcting its pessimism.
2. Mediocre Companies at Very Low Prices (“Dirt Cheap”)
The deeper, riskier form of cheapness.
A mediocre company — inconsistent earnings, weak competitive position, operational issues — can trade at extremely low valuations. The market is often pessimistic for good reasons. But sometimes the price overshoots reality, creating a potential bargain.
Characteristics
Quality: average or weak
Price: extremely low
Expectations: extremely low
Risk: high
Upside: possible, but depends on a turnaround
This is the realm of deep value. It can work, but it requires humility: many companies are cheap because they deserve to be.
The Asymmetry Core
The part that finally makes the whole model click
Asymmetry has nothing to do with whether a company is “good” or “mediocre.” It has everything to do with whether the price reflects the wrong probabilities.
When investors say:
“Look for situations where the market is underestimating the good outcomes and overestimating the bad ones,”
they mean:
Bad outcomes are priced as too likely, and
Good outcomes are priced as too unlikely.
This is mispricing — and mispricing is where asymmetry lives.
The market doesn’t reward you for:
liking a company
admiring a company
believing in a company
buying a “great” company
It rewards you for spotting wrong expectations.
A Tiny Example That Makes It Obvious
If the market thinks:
80% chance things go badly
20% chance things go well
But reality is closer to:
40% chance things go badly
60% chance things go well
Then the market is:
overestimating the bad, and
underestimating the good.
That’s asymmetry — regardless of whether the company is “great” or “mediocre.”
How This Fits the Hierarchy
Good company priced as mediocre
Market too pessimistic
Strengths ignored
Clean asymmetry
Mediocre company priced very low
Market maybe too pessimistic
Improvement underestimated
Riskier asymmetry
Great company priced for perfection
Market too optimistic
Risks ignored
No asymmetry
Now the entire framework aligns.
The 3‑Question Asymmetry Test
A 10‑second diagnostic for spotting mispricing
Ask yourself:
Are expectations already low? If the price is built on pessimism, downside is limited.
Is reality better than the price implies? If yes, the market is underestimating the good outcomes.
Is there a catalyst that could shift sentiment? Without a catalyst, mispricing can stay hidden for years.
All three yes → asymmetry Two yes → watchlist One yes → noise Zero yes → hype
The Essence in One Breath
You’re not hunting for great companies — you’re hunting for wrong expectations. Asymmetry appears when the price reflects the wrong probabilities.